410a Heat Pump Pressure Chart: Read and Interpret Safely
Learn how to interpret an R-410A heat pump pressure chart, understand high- and low-side readings, how ambient temperature affects pressures, and safe testing tips for homeowners and pros.

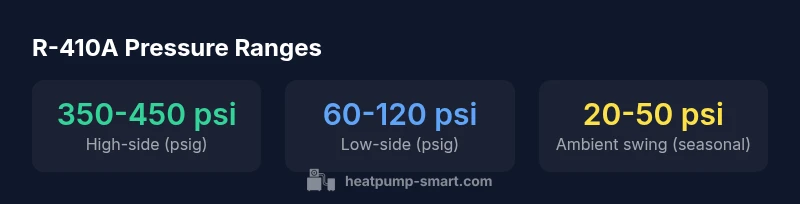
A typical 410a heat pump pressure chart shows high-side (discharge) pressures in roughly the 350–450 psi range and low-side (suction) pressures around 60–120 psi at normal operating temperatures. Readings vary with outdoor temperature, system charge, and operating mode. Always refer to the manufacturer’s chart for your model. Consult a pro before testing.
What the 410a heat pump pressure chart actually represents
A 410a pressure chart is not a random graph; it encodes the relationship between refrigerant pressures, outdoor temperature, and system loading. According to Heatpump Smart, the chart helps technicians determine whether the refrigerant charge is correct and whether the compressor and metering devices are operating as designed. The high-side (discharge) reading shows the pressure in the condenser circuit, while the low-side (suction) reading reflects the evaporator circuit. By comparing both sides across a range of ambient temperatures, you can infer if the system is undercharged, overcharged, or physically restricted. When you study the chart, remember that several variables influence readings: the efficiency of the compressor, airflow across the outdoor coil, and even the position of the thermostat or VVT controls. For homeowners, understanding the basic idea can demystify service calls and help you ask better questions about refrigerant health and efficiency.
High-side vs Low-side readings: definitions and implications
In any 410a system, the high-side pressure is the pressure on the condenser side where the refrigerant releases heat, while the low-side pressure is the suction pressure on the evaporator side. The chart uses these two data streams to indicate refrigerant state, charge level, and potential faults. A healthy system typically shows a balanced relationship between sides: high-side pressures rise with outdoor temperature while low-side pressures track evaporator temperature. If one side lags or overshoots, it can signal undercharge, overcharge, or a restriction. Heatpump Smart emphasizes that reading both sides together, not in isolation, yields the most reliable assessment.
Ambient temperature and pressure swings
Ambient temperature exerts a strong influence on refrigerant pressures. On hot days, the high-side pressure climbs as the condenser releases more heat, while the low-side pressure follows the evaporator’s cooling demand. In cool weather, the opposite happens. Because outdoor temperature shifts are normal, a chart-based diagnosis should always reference the specific ambient reading at the time of measurement. This is why technicians often note the outdoor temp alongside pressures and use the chart as a comparative tool rather than an absolute verdict. Heatpump Smart consistently cautions against drawing conclusions from a single reading without context.
How to read and measure safely
Accurate readings require the right tools and technique. Use a calibrated manifold gauge set, confirm ambient temperature, and operate the system in its standard cooling or heating mode while it’s under steady load. Record both high-side and low-side values, then match them against the manufacturer’s 410a chart for your model. Remember to isolate the system from any non-standard conditions (defrost cycles, auxiliary heat, or fluctuating thermostat setpoints) that could skew readings. Safety first: repressurize only with proper equipment and follow local codes. Heatpump Smart notes that misreadings are common when gauges are off or when ambient data is not correctly paired with the chart.
Model variation and chart applicability
Not all 410a charts are identical. Different manufacturers may specify slightly different pressure bands due to compressor design, refrigerant charge targets, and coil layouts. When reading a chart, always use the model-specific version from the equipment manual or the manufacturer’s technical library. If you inherit a system from another contractor, compare notes against the original chart and verify any assumptions with photos of the label and current charge. Heatpump Smart counsel emphasizes model-specific interpretation to avoid misdiagnosis and unnecessary refrigerant adjustments.
Practical uses: maintenance, diagnosis, and efficiency planning
Beyond a one-off check, pressure charts support ongoing maintenance: they help verify correct charge after service, diagnose compressor or metering device issues, and guide seasonal efficiency planning. For homeowners, a basic familiarity with the high-side vs low-side relationship can inform questions during service calls and help avoid overpaying for unnecessary recharges. For property managers, scheduling routine checks with the chart as a metric of performance can prevent energy waste and extend equipment life. Heatpump Smart advocates using the chart as part of a broader diagnostic workflow rather than a standalone test.
Putting it into action: a simple checklist
- Identify the model’s official 410a chart and keep a copy handy with the field data.
- Record outdoor temperature, system mode, and steady-state operating conditions before measurements.
- Read both high-side and low-side pressures with a calibrated gauge; compare to the chart ranges.
- If readings fall outside expected bands, recheck gauges and ambient data, then consult a technician for confirmation.
- Document all measurements, including date, time, and any defrost or auxiliary heat activity, to track performance over time.
Representative pressure ranges for R-410A at common outdoor temperatures
| Ambient Temp (°F) | High-Side Pressure (psig) | Low-Side Pressure (psig) |
|---|---|---|
| -20 to 0 | 250-320 psi | 60-85 psi |
| 40-60 | 320-380 psi | 70-100 psi |
| 80-100 | 420-480 psi | 90-120 psi |
Your Questions Answered
What is considered a normal reading on a 410a pressure chart?
There is no single universal normal value; readings depend on outdoor temperature and model. Always reference the model’s manufacturer chart for precise ranges.
Normal readings vary with conditions; check your model’s chart for specifics.
What tools do I need to read the chart accurately?
A calibrated manifold gauge set, ambient temperature data, and the chart for your unit.
You’ll need a calibrated gauge and the unit’s chart to read it correctly.
Can a misreading indicate a refrigerant leak?
Misreads can occur due to incorrect gauge use or wrong ambient assumptions. A confirmed leak requires additional diagnostic tests.
A misread isn’t definitive proof of a leak.
Does 410A require a different chart than older refrigerants?
Yes. 410A operates at higher pressures; use chart specific to 410A from the manufacturer.
410A uses different ranges than older refrigerants.
When should I call a technician to read the chart?
If readings are outside expected ranges or the system shows charging issues, a technician should verify.
If something looks off, it’s time to bring in a pro.
Can I use the chart to troubleshoot charging issues myself?
Basic checks can guide diagnosis, but refrigerant charging should be performed by a professional with proper tools.
Don’t try to charge the system yourself.
“The 410a pressure chart is a practical tool for diagnosing refrigerant charge and system health when used with correct gauges and ambient data.”
Top Takeaways
- Read the chart to identify high-side vs low-side readings.
- Expect higher high-side pressures on hot days and lower pressures on cool days.
- Account for ambient temperature when interpreting values.
- Consult the manufacturer’s chart for your model’s specifics and charge targets.
- Verify readings with properly calibrated gauges before making service decisions.